
Want to work with our team?
Get in touch
We are big fans of using data to support our decision-making. We use data and insights when designing and building websites: from the very start of the project, all the way through to our ongoing, post-launch support. In fact, we don’t believe you should ever stop analysing the data to make tweaks and improvements to your website.
There are lots of tools out there that can gain insights into your users and website. In the first of our articles, we’re looking at Google Analytics which is the most well-known. It’s highly likely that it's already installed on your website, but what is it? And what can you learn by using it?

What is Google Analytics?
Google Analytics allows you to understand, track and analyse your website's users across different browsers and devices on your website, for free. As it’s a Google product, there’s the added benefit that it can integrate easily with Google’s marketing tools - such as Google Ads. When you first start using Google Analytics, it can be somewhat overwhelming; there’s a lot of information and a lot of data to look through.
We’re going to look at the areas that we find most useful and why below.
Audience
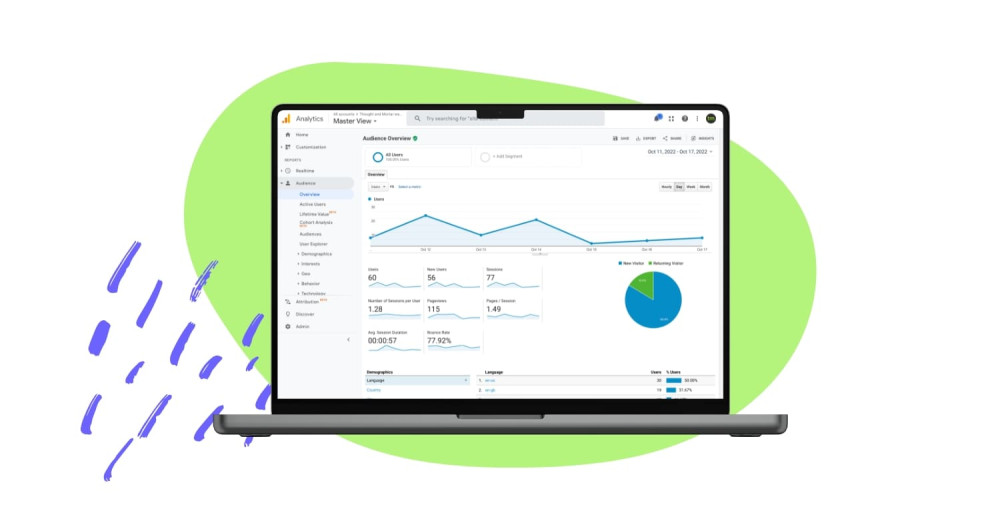
The audience overview tab gives an insight into who is visiting your website, where they are coming from, how long they are staying on your site, and what platform they are using. The metrics on this page are very useful as they enable you to see if you’re attracting the right audience.
You can quickly see:
The bounce rate: the lower the bounce rate, the better. This means that users aren’t just landing on your website and leaving straight away. You should be aiming for a bounce rate under 40%.
Pages / Session: this is how many pages a user visits each time they visit your website. The higher the number, the longer they’re spending on your website, which means they’re interested in your content.
Location: If you’re a UK-based company, you’ll likely want to attract UK-based visitors. Here you can ensure you’re being seen by the right audience.
New/returning: In an ideal world you’d have a lot of both new and returning visitors but if you have a high percentage of visitors returning it means they liked your content the first time around.
You can also drill down much deeper into your audience using the tabs below the overview.
The areas worth exploring are:
Demographics: Here you can confirm that the audience engaging with your website is your target audience. However, if it’s not or you’ve never really given much thought to your target audience (you really should), you can find out their age, gender, and interests. This means you can tailor your content and tone of voice to appeal to that specific demographic and if you’re undertaking an ad campaign you can ensure you’re targeting the correct people.
Technology and mobile: These two tabs allow you to see what devices, browsers, and screen resolution your users are visiting your website on. This information can be really important. Especially when you combine that information with page views, visit duration, and bounce rates. For example, if your bounce rate is generally low but on one specific screen resolution, it’s significantly higher it might indicate that the user experience isn’t very good for that screen resolution.
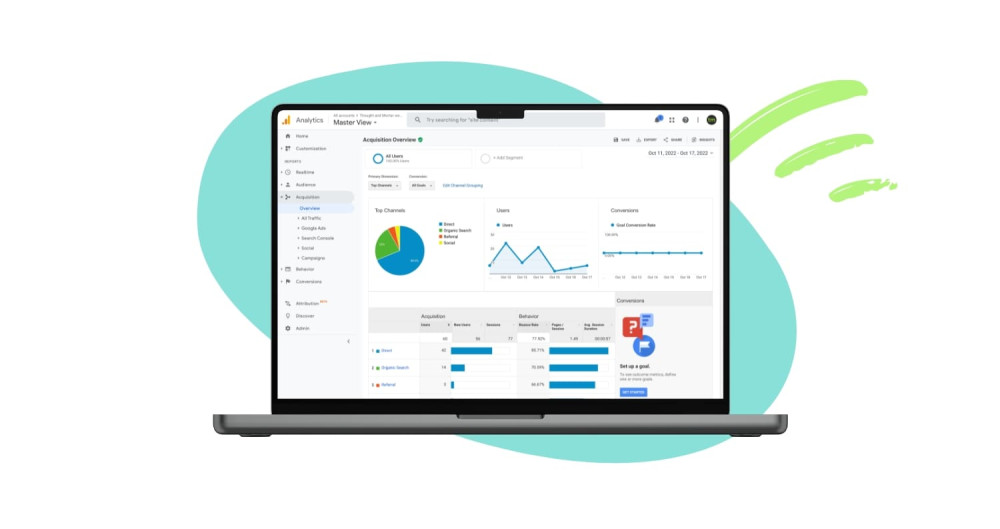
Traffic sources
The second area within Google Analytics that we like to look at is the Acquisitions tab. This area tells you where people are coming from and what the bounce rate, session duration, conversion rate, and revenue is from each channel.
If you’re running any Google Ads campaigns, you’ll see an overview of how well they’re doing here along with the above stats for your social channels.
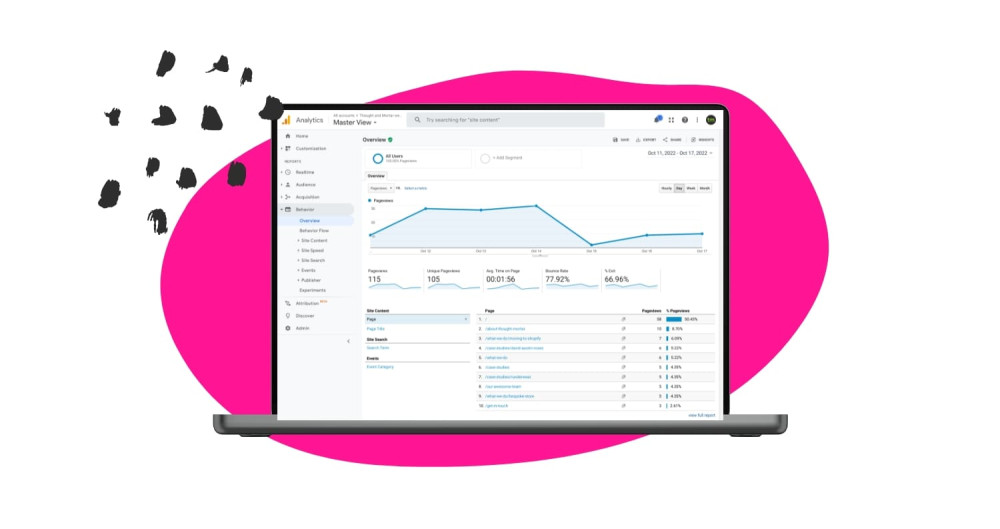
Behaviour
The third area we look at is the behaviour tab. Here you see what users do once they’ve landed on your website. The two key areas here are:
Site Content: This section allows you to see data on a page-by-page basis. You’re able to easily see the most viewed pages, the time spent on each page, and the page bounce rates.
Site Search: If you have search functionality on your website this area is very useful. You’re able to see what percentage of site visitors use the search, what they searched for, whether they stayed on the website after they searched, and how long for.
By analysing the above data you can understand who your customers are and how they use your website, which can lead to improvements in your marketing strategy, your content, and SEO. These improvements can help your business grow and improve your ROI.
Want to work with our team?
Get in touch